Tuesday, November 30, 2021

A Green Light for Muni Customers

A Green Light for Muni Customers
By Stephen Chun

Have you ever been on a Muni vehicle and realized that if the light had only stayed green for just a few more seconds you wouldn’t have been trapped at a red light? SFMTA’s Connected Corridor Pilot approached this problem with a new state of the art solution.  

Most signals in San Francisco do not have sensors to detect vehicles at an intersection. However, through a grant from the U.S. Department of Transportation, our project team was able to test an advanced technology for signal timing based on who is present at an intersection. In this way, transit platform and traffic signal sensor data can be used to activate signal timing adjustments, responding to traffic conditions in real time. These adjustments provide more opportunities for transit vehicles to make it through intersections on a green light.   

The project team turned on the adaptive signal timing program during several days in July and August 2021, with traffic engineers and traffic signal electricians monitoring intersections both in-person and by observing traffic cameras. Our priority was to reduce transit vehicle travel times. Once in place, we compared travel times for trains both before and after the new technology was implemented.  

We found that with our pilot project, the average light rail vehicle (LRV) travel time along the 1-mile corridor was reduced by 66 seconds, resulting in an average travel speed increase of 21% from 8.2 miles per hour (MPH) to 9.9 MPH. With this system, the chance that a train will reach an intersection on a green light improved from 62.1% to 85.8%, meaning almost no red-light delay.     
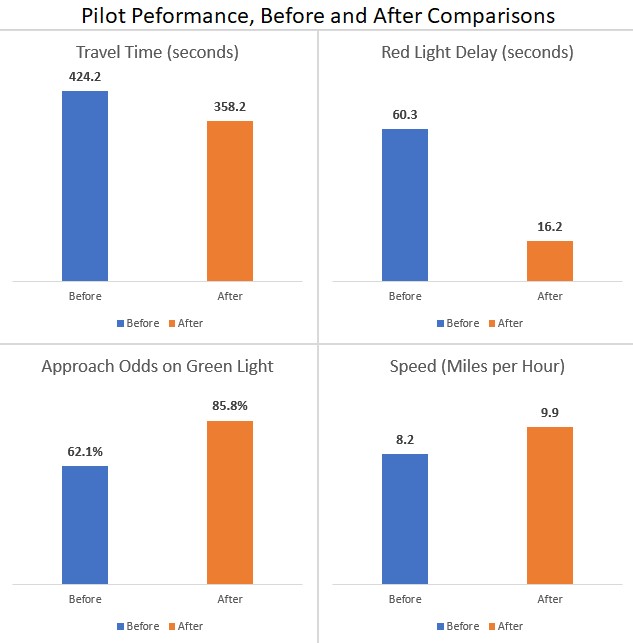
Connected Corridor - Pilot Performance, Before and After Comparisons

Figure 1. Pilot Corridor Performance, Before and After Comparisons 

During the pilot, 60% of LRV corridor trips had 10 seconds or less of red-light delay, compared to only 5% previously.  In fact, 20% of trains saw no red-light delay at all on the corridor, compared to the previous study period when not a single train avoided red light delay entirely.   

Improving signal timing for just one specific mode or direction can potentially result in negative impacts for others.  To evaluate this, we measured travel impacts to pedestrians and non-Muni vehicles to evaluate the potential effects from prioritizing transit.  Fortunately, our data show that there was a 1% increase in the overall odds that other vehicles would encounter a green light and only a 1% increase in the odds that pedestrians would reach an intersection on a Do Not Walk symbol. 

Vehicles on side streets were generally unaffected unless they were also held to prioritize train through traffic. Heavier volume side streets such as Mariposa Street had increased average wait times of up to 78% for vehicles, from an average wait of 46 seconds previously, to an average wait of 87 seconds during the pilot. Fortunately, the adaptive signal system only increased the average wait time by 4 seconds for pedestrians if they arrived on a Do Not Walk symbol, from 22 seconds to 26 seconds.  Further refinement of the signal timing logic could help address these concerns. 

With detailed information collected through the advanced sensors, our project team was able to make refinements and real-time signal timing adjustments that account for time of day, direction of travel, and the real-time volume of pedestrians, vehicles, and transit vehicles.  

These promising results will lead the SFMTA to consider applying this technology in other locations to better understand how the system could work more widely around the city and any trade-offs that could arise in regard to overall traffic flows. 

Looking forward, we are also exploring other new technologies. For example, the LiDAR (sensors that use lasers to identify objects) used in this project provides a new way to capture and classify objects at intersections, but there may be a need for additional sensors or different mounting locations to improve detection accuracy. Project staff will build upon the lessons learned from the pilot to inform future efforts to optimize the signal timing to make our streets better for all users.   


Published December 01, 2021 at 02:31AM
https://ift.tt/31fWtr4
Monday, November 29, 2021

Watch San Francisco’s Bike Network Bloom

Watch San Francisco’s Bike Network Bloom
By Eillie Anzilotti

From just a few stretches of scattered lanes in 2013, San Francisco’s protected bike network now stretches like a green web connecting more and more of the city. See how much has changed over the last eight years:


In just the blink of an eye, San Francisco has become one of the most bike-friendly cities in the U.S. To date, San Francisco has 464 miles of bikeways, including:

  • 42 miles of protected bike lanes
  • 78 miles of off-street paths and trails
  • 21 miles of buffered bike lanes
  • 139 miles of striped bike lanes

As we’ve expanded the network of safer bicycle routes through San Francisco, more people are choosing to ride bicycles for recreation and transportation every year. Since 2006, travel by bicycle has grown by 184 percent citywide. Before the COVID-19 pandemic, bike counts hit an all-time high: in 2019, approximately 52,000 bicyclists were observed at 37 locations during peak periods, a 14 percent increase from the previous year.

Creating safe bicycling routes throughout San Francisco is imperative for reaching the city’s Vision Zero goal of eliminating traffic deaths and reducing severe injuries—and also for encouraging more people to choose to travel by bike. In the last several years, the SFMTA dramatically accelerated installation of safe bicycling infrastructure. In 2019, Mayor London Breed committed to doubling the rate of bike lane construction in the city from an average of five miles per year to 20 miles over the following two years. That same year, the SFMTA launched its Vision Zero Quick-Build program to roll out safety improvements, including protected bike lanes, along the city’s High Injury Network. Compared to more intensive capital projects that can take years to complete, quick-build projects can transform a street in a matter of weeks or months. See that jump in bike infrastructure after 2019? Quick-Builds were behind a lot of it.

COVID-19-related street transformations were also part of the reason behind the most recent increases in bike infrastructure. While the pandemic posed a number of challenges for the city, bike route planning, design and construction took off! With the addition of Slow Streets and car-free streets like JFK Drive, the city’s bike network grew by approximately 50 miles and increased connectivity between many of San Francisco’s neighborhoods. While these street transformations were introduced as part of an emergency response, we are exploring ways to establish them as permanent parts of San Francisco’s streetscape and bike network.

Looking to the future, as part of the 2021 Vision Zero Action Strategy, the SFMTA is committing to create a citywide, completely connected Active Transportation Network that includes bike lanes, Slow Streets, and car-free/car-light streets. We’re excited to keep building on last eight year’s bike network progress, adding even more green lines to the San Francisco map.


Published November 30, 2021 at 03:54AM
https://ift.tt/3E82RyG

Wednesday, November 24, 2021

From Elkton to Green, the Evolution of Muni’s Oldest Rail Yard

From Elkton to Green, the Evolution of Muni’s Oldest Rail Yard
By Jeremy Menzies

In part two of our two-part series on one of the city’s oldest transit properties, we bring you the history of Muni’s Green Division. Green Division, also known as Muni Metro Center, has served as the primary maintenance and repair facility for our rail fleet for over 40 years.

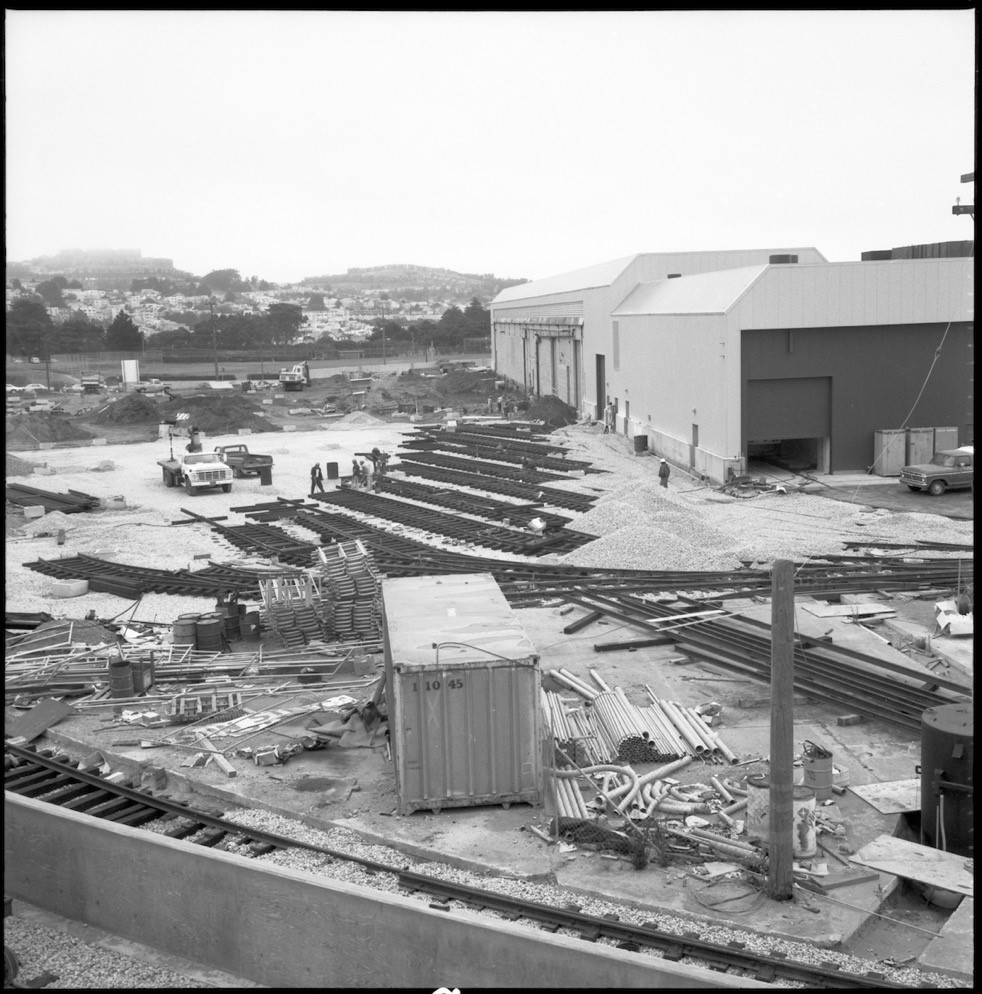
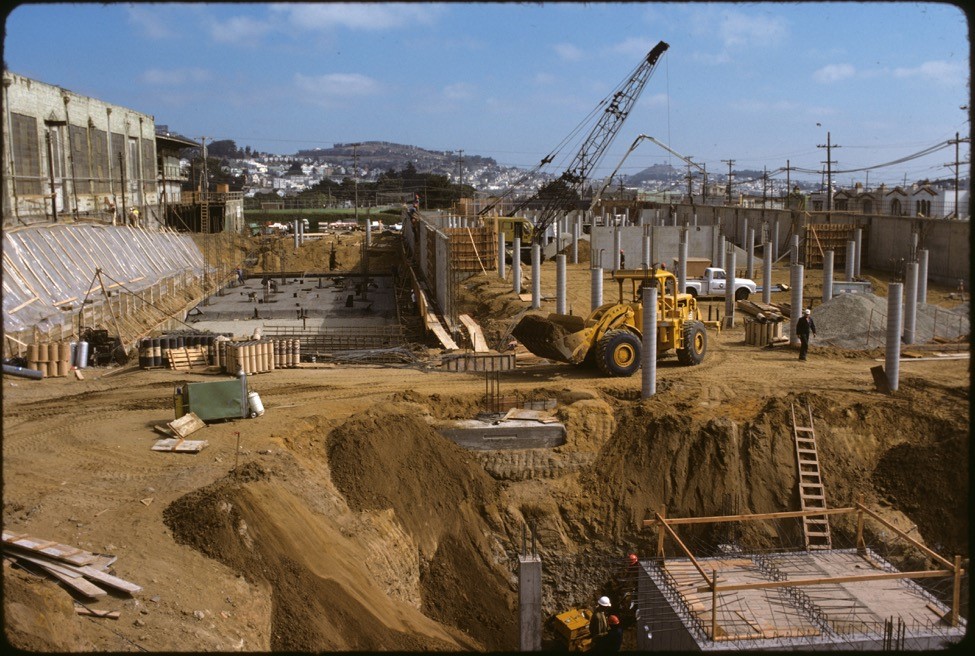
Construction began on Green Division in 1975. This new rail facility would replace Elkton Shops, which was built in 1907. The new shops were built in two phases, first the shop building then the rail yard.

This 1976 photo shows major excavation and concrete work underway for the main shops building of Green Division.  At far left is Elkton Shops built in 1907 by the United Railroads Company.This 1976 photo shows major excavation and concrete work underway for the main shops building of Green Division.  At far left is Elkton Shops built in 1907 by the United Railroads Company.
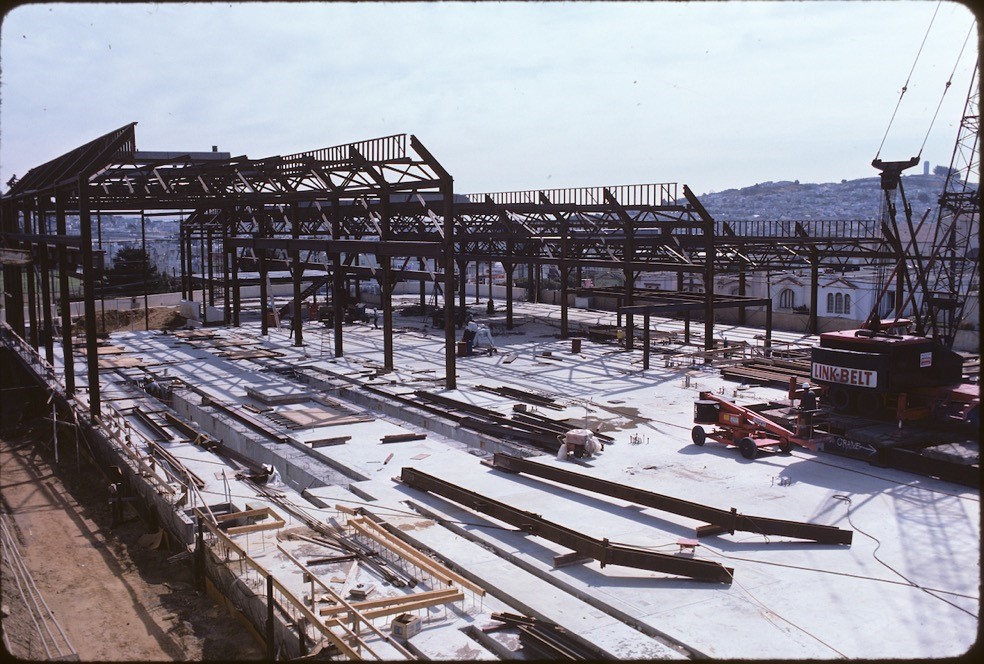
In phase one of the project, crews demolished the bus yard occupying the eastern half of the property and built a massive new building that would house repair and maintenance shops for a new fleet of Muni rail vehicles. This phase took about two years to complete.

Construction progress on Muni Metro Center in November 1975 shows the main structure of the building taking shape.

Construction progress on Muni Metro Center in November 1975 shows the main structure of the building taking shape.

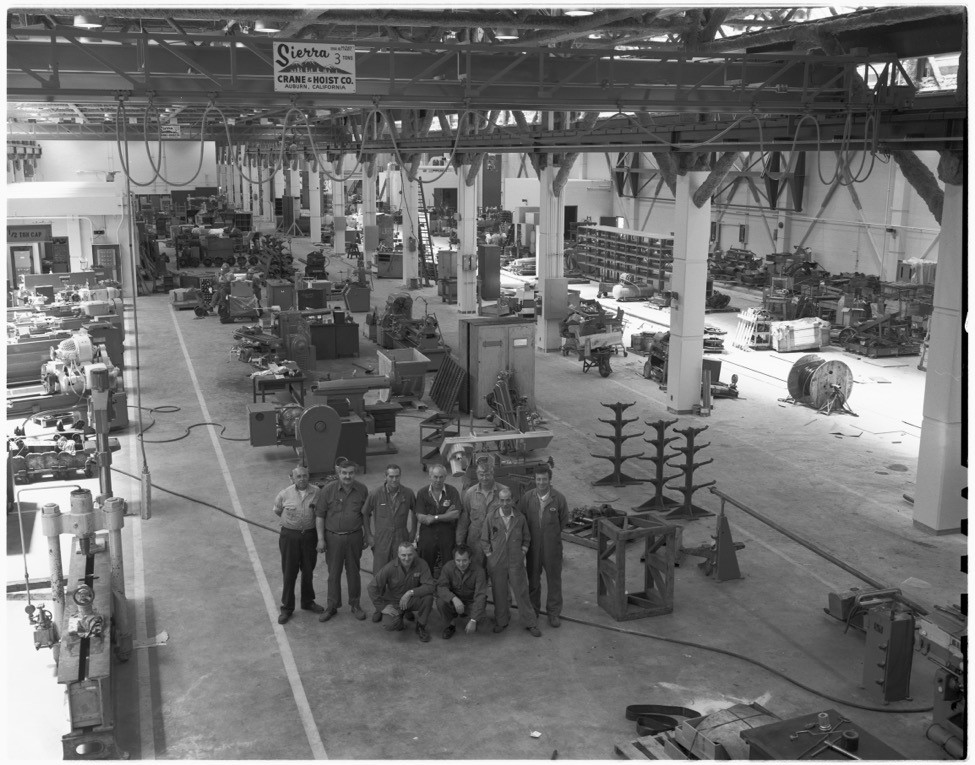
By May 27, 1977, the new shop building was completed and employees finished their last day of work in the 70-year-old Elkton Shops. Just a few days later, they moved into a brand-new building and demolition began on Elkton to make way for construction of a large rail yard in phase two of the project.

This staff group photo was taken on opening day of Muni Metro Center on June 1, 1977.

This staff group photo was taken on opening day of Muni Metro Center on June 1, 1977.

Work on the rail yard progressed quickly as Muni was anticipating the arrival of the first light rail vehicles or LRVs, a modernized version of the electric streetcars of the past. The new LRVs were designed and built by the Boeing Vertol company in a joint venture between Muni and Boston’s MBTA. The new vehicles would run in the Muni Metro, which combined Muni’s surviving streetcar lines with a subway underneath Market Street to create a more integrated rail system.

Aerial photo of construction on the rail yard where Elkton Shops once stood from August 1977

Work progresses on the rail yard where Elkton Shops once stood in this August 1977 photo.

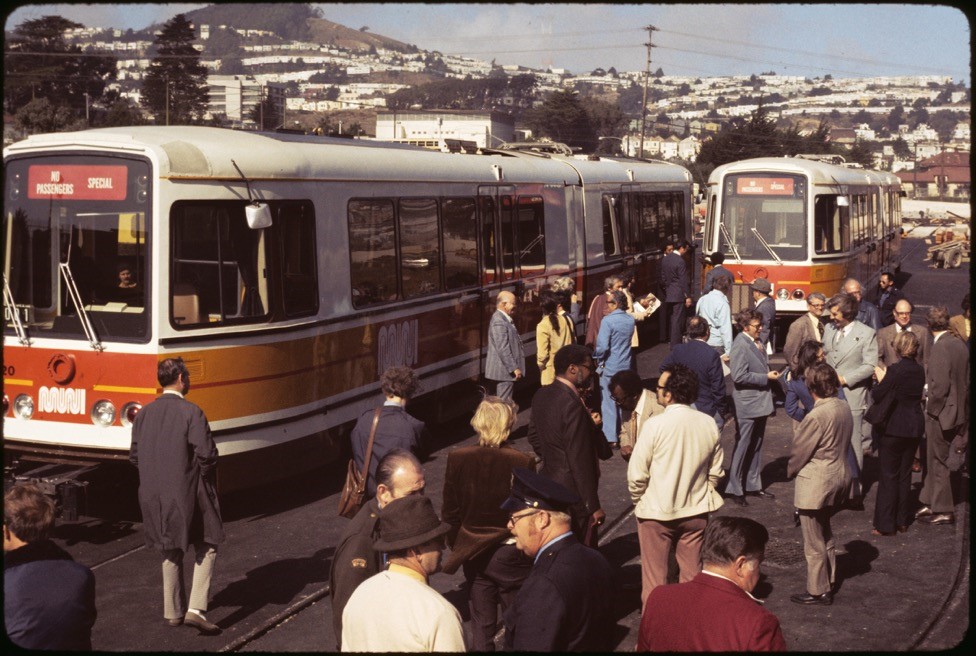
The arrival of Boeing LRVs came in October 1977 while the rail yard was still under construction. A small crowd of city officials, staff and press celebrated the arrival of the first two cars outside Green Division. In a short time over 100 LRVs would come to form the backbone of all Muni rail lines.

This October 24, 1977 photo shows Muni’s first two LRVs on display after arrival from the factory.

This October 24, 1977 photo shows Muni’s first two LRVs on display after arrival from the factory.

On July 11, 1979, Muni Metro Center was dedicated and a new fleet of LRVs waited in the yard to start serving the city. Just one year later, the Muni Metro system and Market Street Subway would open and the railyard’s key role in maintaining the new fleet would come into full effect.

1979 aerial shot looking southwest near San Jose and Ocean Avenues shows a newly completed Muni Metro Center and surrounding area

This November 1979 aerial shot looking southwest near San Jose and Ocean Avenues shows a newly completed Muni Metro Center and surrounding area.

On May 12, 1987, Muni Metro Center was re-dedicated as the “Curtis E. Green Light Rail Center” in honor of former Muni General Manager Curtis E. Green, who worked his way up from a bus driver to become the first African American appointed head of Muni.

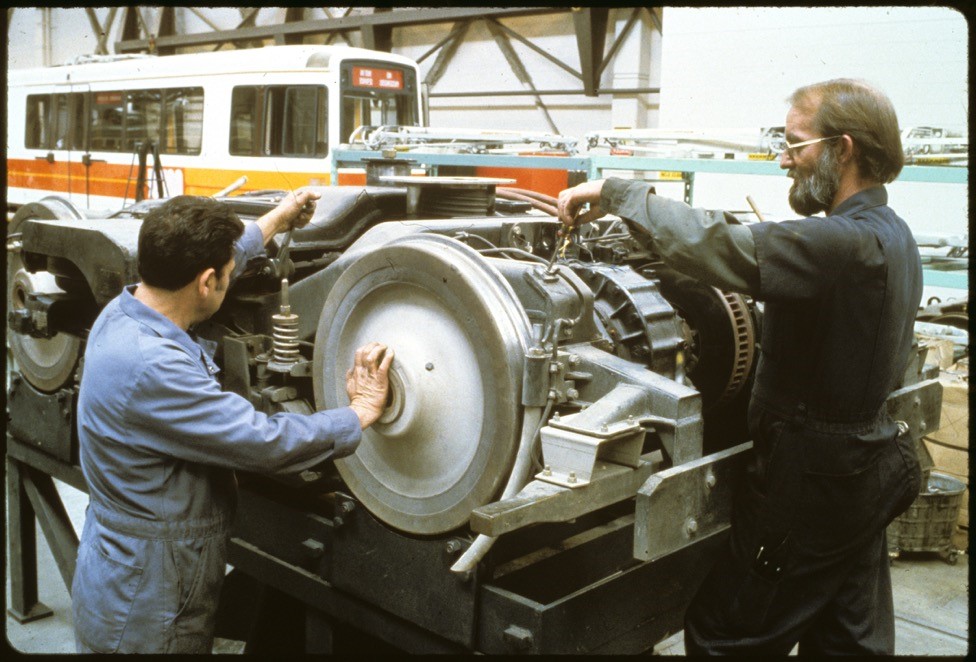
Green Division shop staff work on the truck from a Boeing LRV in this early 1980s photo.

Green Division shop staff work on the truck from a Boeing LRV in this early 1980s photo.

​​​​​​​Today, staff at Green Division carry on an over 100-year-old tradition started in 1907 with the United Railroads’ Elkton Shops. Working daily performing every job from routine maintenance and inspections to overhauling major components, the shops are critical to moving San Francisco.


Published November 24, 2021 at 11:10PM
https://ift.tt/3FJQadR

Friday, November 19, 2021

Safer Intersections Project a Traffic Calming Success

Safer Intersections Project a Traffic Calming Success
By Uyen Ngo

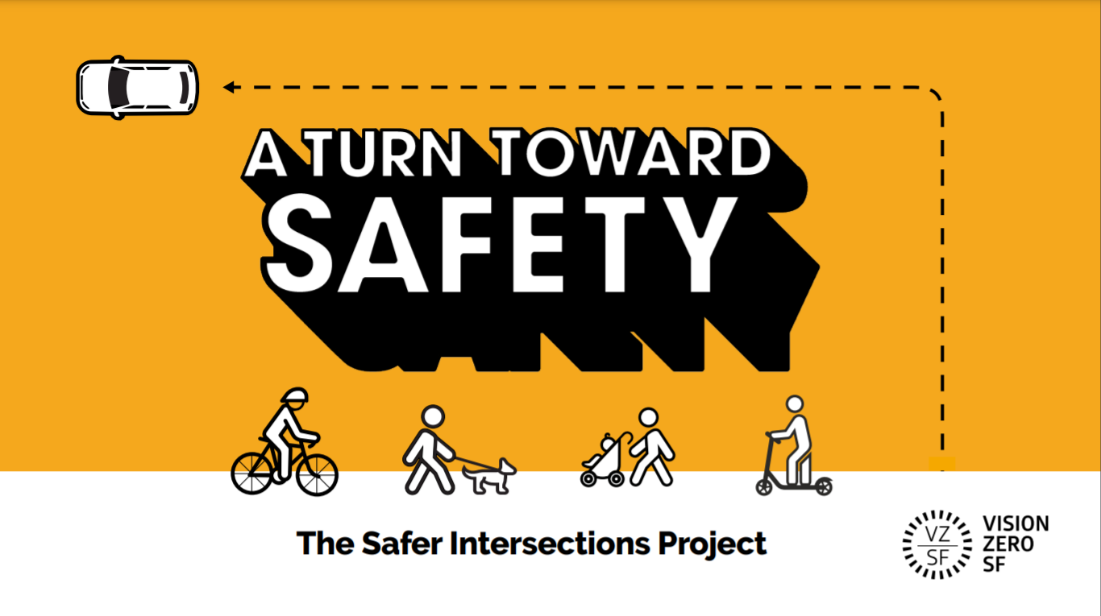
mage from Vision Zero SF entitled “A Turn Toward Safety” with images of a person on a bicycle, a person walking a dog, a person pushing stroller with a baby in it, and a person on a scooter

This week the San Francisco Municipal Transportation Agency (SFMTA) released “A Turn Toward Safety: The Safer Intersections Project,” a report detailing the impact of the Left Turn Traffic Calming Project and the “Safety—It’s Your Turn” education campaign. The Safer Intersections Project now has tested traffic interventions that can reduce unsafe left turns. Overall, SFMTA found a 17% reduction in average speed (1.7mph slower) and a 71% reduction in the likelihood of a car turning left at higher speeds over 15mph at seven high-crash test intersections.

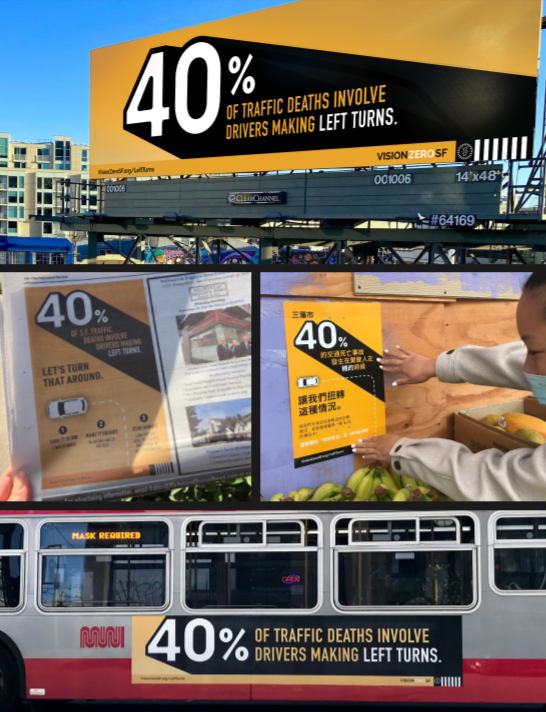
In 2019, 40% of traffic deaths in San Francisco were caused when drivers made left turns and didn’t see the person in the crosswalk, until it was too late. To combat this trend, also seen in other cities, and encourage safer left turns and adoption of safer left turn behaviors, San Francisco’s multilayered project combined engineering treatments in seven high-crash intersections with an education campaign, which led to promising results.

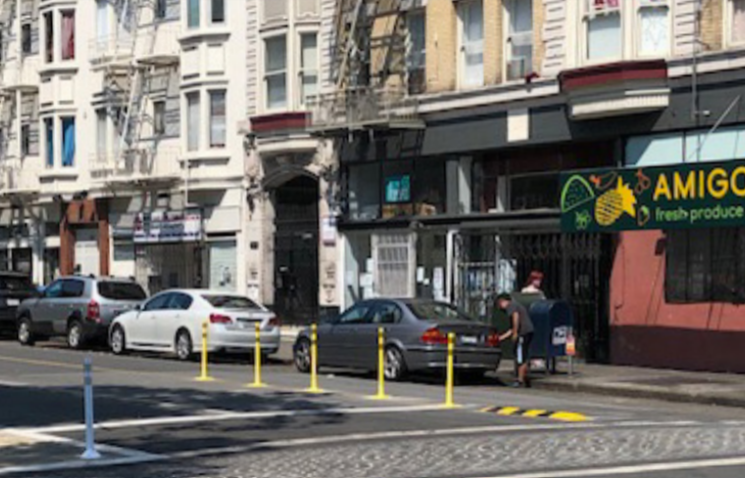
The Left Turn Traffic Calming Project consisted of installing waist-high vertical delineator posts, small rubber speed bumps, and paint to create enhanced center lane lines and painted safety zones to encourage slower, wider left turns and increase drivers’ awareness of other road users. To measure the impact, SFMTA collected left-turning driver speeds before and after installation and then compared driver speeds at the seven project intersections with four other control intersections. The result of this project showed that these treatments are proven to slow driver speeds and encourage safer left turns for both people in the crosswalks and opposing traffic.

photo of plastic safety posts separating a bike lane from a general traffic lane

The second part of the Safer Intersections Project was designing and implementing an education and community outreach campaign– “Safety—It’s Your Turn” –funded by a $2 million grant through the California Transportation Commission Active Transportation Program. The campaign presented three safer left turn behaviors (Take it slow—5mph is safest; Make it square—90-degree angles are best; and Stay aware—look out for cars, cyclists, and people) and data suggests the “Safety—It’s Your Turn” campaign extended the speed reductions from the Left Turns Traffic Calming project. Year-to-year survey results also show that public perception of the dangers of speeding is trending in the right direction, indicating a sustained change in attitudes influenced by education campaigns and engineering.

A unique aspect of this project was the use of behavioral science. SFMTA partnered with the Behavioral Insights Team (BIT), a leading behavioral science organization, to analyze how drivers make left turns in order to develop interventions that would prompt safer behaviors. By changing the architecture of intersections, we were able to move people toward making safer left turns in the moment. The combination of these physical changes and SFMTA’s educational campaign encouraged safe driving behaviors and increased awareness of how individual actions have an impact on the community.

montage of three posters and a sign on a bus that state 40% of traffic deaths involve drivers making left turns


The education campaign also included working with community-based organizations (CBOs) to broaden and deepen the traffic safety messaging. Through a community grant process, six CBOs were compensated for their time and knowledge, creating additional materials and events supporting the campaign. Many of our grantees were new to Vision Zero and helped us reach additional residents through creative ways such as food delivery, artistic public service announcements, virtual bike rides, and youth poster contests. Finally, we worked with an additional eight CBOs to share educational materials and present the Safety—It’s Your Turn campaign to their members.

In addition to the treatments’ impact on slower speeds, there were two key takeaways from the project:  

  1. Well-funded and evidenced-based education campaigns are an important and effective tool in in raising public awareness, encouraging safer driving behaviors, influencing policy discussions, and building community support.  
  2. For maximum effectiveness, calming treatments should become a standard engineering tool and applied at locations with existing high left-turn speeds, conducive street geometry, and lots of people walking and biking. 


Published November 19, 2021 at 09:58PM
https://ift.tt/3FyixLU

Thursday, November 18, 2021

San Francisco Announces Bold Commitment to Safer Streets

San Francisco Announces Bold Commitment to Safer Streets
By Ryan Reeves

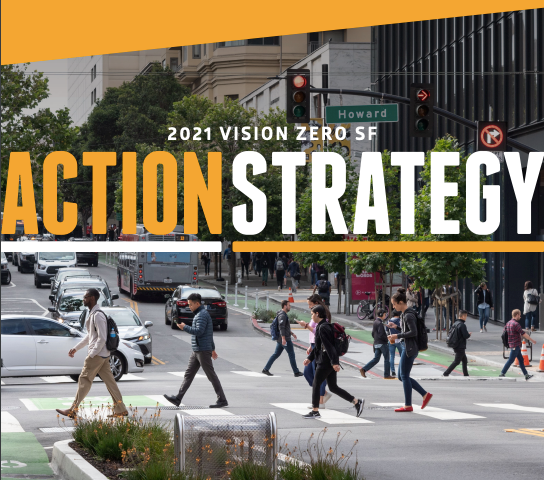
Photograph of pedestrians crossing Howard Street; protected bike lanes in the foreground and background. “2021 Vision Zero SF Action Strategy” is overlaid on the image.

This week, San Francisco Mayor London Breed released  the 2021 Vision Zero Action Strategy—our City’s multi-agency framework for eliminating traffic deaths and reducing severe injuries.

The City and County of San Francisco committed to ending traffic fatalities through Vision Zero in 2014. Since then, our approach has continued to evolve – we've incorporated new strategies and expanded on existing and successful programs. In this updated plan, we commit to bold and ambitious strategies to create safer streets. We will double down on redesigns to make streets safer for people, and expand programs like our Vision Zero Quick-Build across the city’s High Injury Network (HIN), the 13% of city streets that account for more than 75% of severe and fatal injuries.

The Vision Zero Action Strategy lays out a clear path for the city towards this ambitious goal over the next three years. The strategy focuses on slowing speeds and safer crossings. More than 80 miles of our city’s High Injury Network have been upgraded or are in construction with core safety improvements. This strategy commits the City to expand the successful Quick-Build initiative to cover the remaining 80 miles in the High-Injury Network. As part of this effort, we are committed to adding daylighting and high-visibility crosswalks to every intersection along the HIN. We will also update all eligible signals to give pedestrians head-starts and more time for crossing the street. The strategy also commits us to updating our City’s Active Transportation Network, connecting car-light/car-free streets to protected bike lanes by 2024. Through these design changes, we can make walking, biking, and taking transit safer and more accessible for San Franciscans.

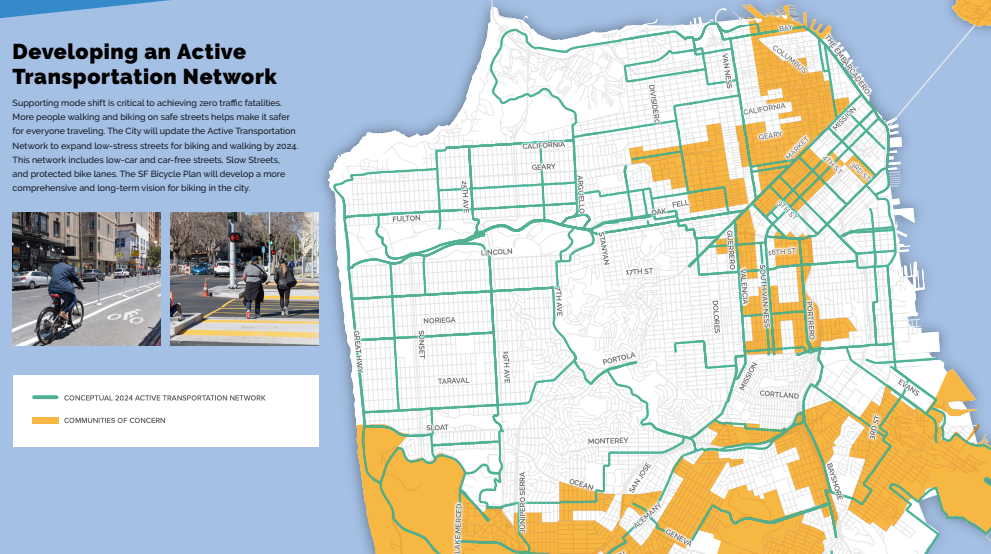
A page from the Vision Zero Action Strategy describing San Francisco’s plan to establish an active transportation network. Supporting mode shift is critical to achieving zero traffic fatalities. More people walking and biking on safe streets helps make it safer for everyone traveling. The City will update the Active Transportation Network to expand low-stress streets for biking and walking by 2024. This network includes low-car and car-free streets, Slow Streets, and protected bike lanes. The SF Bicycle Plan will develop a more comprehensive and long-term vision for biking in the city. The map shows a conceptual 2024 Active Transportation Network that covers the whole city, including the Great Highway to the west, Alemany and Lake Merced Boulevard to the south, JFK Drive through Golden Gate Park, Arguello Boulevard into the Presidio, the Embarcadero, and Market Street.

This strategy shows how policy change can make a significant impact in expanding our tools for safer streets. Under the recently passed AB43, which gives cities the authority to lower speed limits along certain corridors, San Francisco will begin implementing 20 mph zones along key streets as early as next year. We will also develop and implement a comprehensive speed management plan, including education and outreach to advance a culture of traffic safety. Lowering speeds by even 5 mph can make a significant difference for safety: We have seen from peer cities like Seattle that implementing 20 mph zones can decrease collisions by around 20%. We will also continue to push for policies like congestion pricing that incentivize mode shifts away from driving and toward active transportation and public transit.

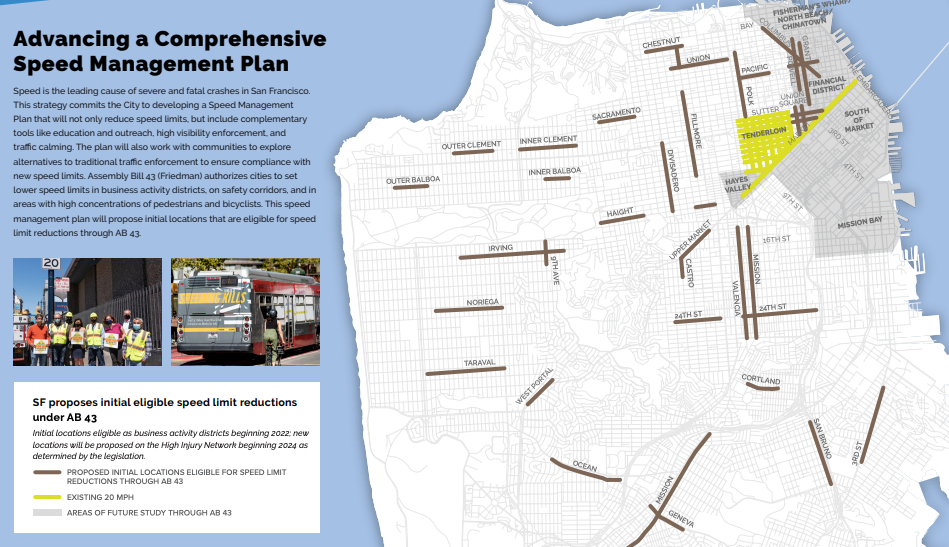
A page from the Vision Zero Action Strategy that outlines San Francisco’s intention to advance a comprehensive speed management plan. Speed is the leading cause of severe and fatal crashes in San Francisco. This strategy commits the City to developing a Speed Management Plan that will not only reduce speed limits, but include complementary tools like education and outreach, high visibility enforcement, and traffic calming. The plan will also work with communities to explore alternatives to traditional traffic enforcement to ensure compliance with new speed limits. Assembly Bill 43 (Friedman) authorizes cities to set lower speed limits in business activity districts, on safety corridors, and in areas with high concentrations of pedestrians and bicyclists. This speed management plan will propose initial locations that are eligible for speed limit reductions through AB 43. The map denotes sections of the following corridors for initial speed reductions: Taraval, Noriega, Irving, 9th Avenue, Outer Balboa, Outer Clement, Inner Clement, Inner Balboa, West Portal, Ocean, Haight, Sacramento, Mission ,Geneva, 24th Street, Upper Market/Castro, Divisadero, Chestnut, Union, Fillmore, Valencia, Cortland, San Bruno, Polk, Pacific, 3rd Street, Union Square, Grant, Powell, and Columbus, Areas for future study include Hayes Valley, Mission Bay, SOMA, the Financial District, Fisherman’s Wharf, North Beach, and Chinatown. The Tenderloin is indicated as an existing 20 mph zone.

As we begin to implement the new Vision Zero Action Strategy, we are keeping equity core to our focus. The Vision Zero HIN is disproportionately concentrated in San Francisco’s communities of color, and vulnerable people—including seniors, people with disabilities, unhoused populations, and people of color—face the greatest risks from traffic-related injuries and deaths. Our Action Strategy prioritizes these communities in engagement, education, and implementation of Vision Zero programs. This past year, we rolled out 20 mph speed limits throughout the Tenderloin, where every street is on the High Injury Network. We are also focused on pursuing legislative authority for new strategies, like speed safety cameras, that are effective in reducing crashes and can reduce racial bias and disparities in enforcement.

This updated strategy commits to bold and ambitious action to get us closer to zero traffic deaths. But to achieve Vision Zero for San Francisco, we know we need the full force of comprehensive policy change, political buy-in, and community support. We need a citywide investment toward lasting, monumental change for our streets. Getting to Vision Zero will take sustained, cross-cutting, and continually innovating action. We’re committed to ending traffic deaths and reducing severe injuries in the city—and will work urgently to save lives on our streets.


Published November 19, 2021 at 03:37AM
https://ift.tt/3CqMNq5

Wednesday, November 17, 2021

4th and King Overhead Line Installation Starts November 17, 2021

4th and King Overhead Line Installation Starts November 17, 2021
By Enrique Aguilar

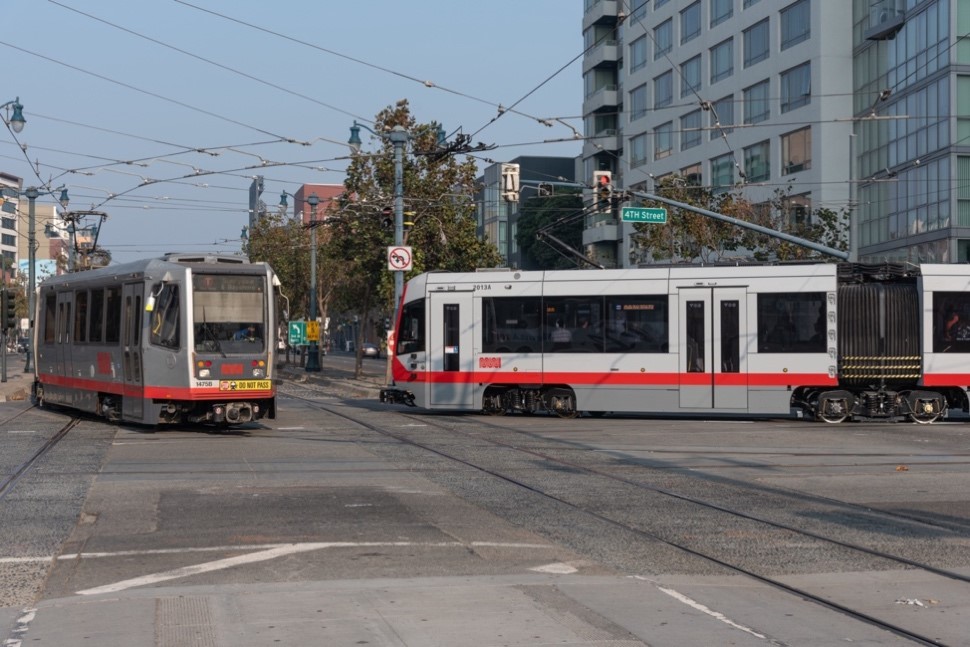
Photo showing two KT Ingleside-Third trains at the intersection of 4th and King streetsHeads up! Installation of overhead line equipment at 4th and King streets starts Nov. 17. Consider taking an alternative route if driving through the area as work for the Central Subway will require detouring traffic. N Judah and T Third rail service will be served by buses starting at approximately 9 p.m. each night that work is performed.
Crews are scheduled to work during nighttime to reduce traffic and Muni service disruption while overhead lines and accessories are installed that will tie the new Central Subway system to the existing T Third Street line. A test train will verify Overhead Catenary System (OCS) installation, which is how zero-emissions electrical power is supplied to light rail vehicles.

Electrical work will start at approximately 9 p.m. on Wednesday, Nov. 17, and should conclude Saturday, Nov. 20. Rail service will resume on schedule Thursday and Friday mornings. Saturday and Sunday rail service will resume later at approximately 8 a.m. The K Ingleside Bus will operate between Balboa Park and the Embarcadero. Customers will need to transfer to the N Judah Bus to continue to Caltrain or T Third Bus for destinations south of 4th and King. The T Third Bus will operate between Castro and Sunnydale and the N Judah Bus between La Playa and Caltrain.

Multilingual signs will be posted at train stops along the KT Ingleside-Third Street and N Judah routes to help Muni customers navigate these temporary service changes.

With 98% of the project completed, installing overhead line wires and equipment at 4th and King adds to a growing list of recent milestones. Other project accomplishments include fare gate and ticket vending machine installation at three underground stations and ongoing testing of critical systems, including train operation testing, which started in August. 

For more information please visit the Central Subway website.


Published November 17, 2021 at 10:24PM
https://ift.tt/3npudur

Tuesday, November 16, 2021

San Francisco's Taxi Medallion Program Moves Onward

San Francisco's Taxi Medallion Program Moves Onward
By

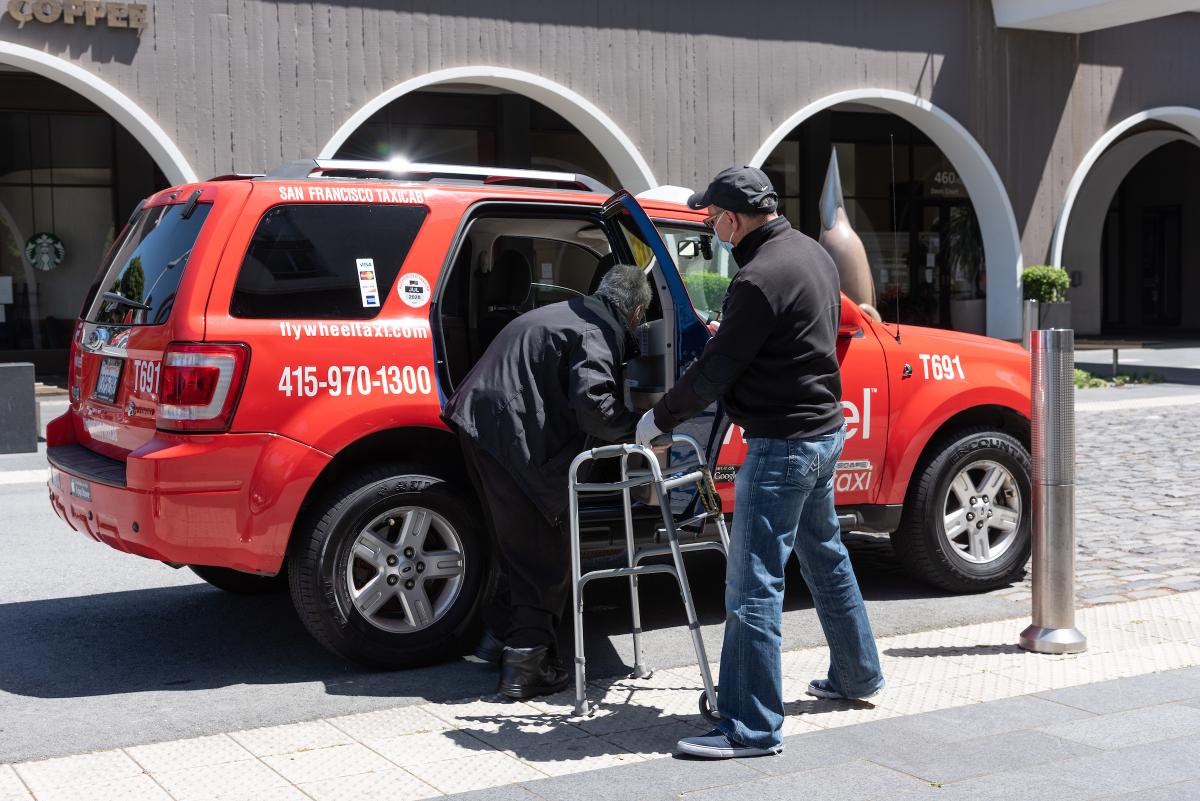
Photo of a taxi driver assisting a passenger with a walkerIn early October, a San Francisco jury found that the SFMTA did not breach its taxi medallion program Lender Agreements with the San Francisco Federal Credit Union.  Throughout this litigation, the SFMTA has continued to focus its attention on supporting purchased medallion holders and drivers.  In fact, over a year ago, the SFMTA made an offer to settle the lawsuit by providing millions of dollars in loan forgiveness to medallion holders.  Unfortunately, the SF Credit Union opted to continue its lawsuit against us.  With the trial now behind us, we are hopeful that the Credit Union will engage in the necessary dialogue with us and agree to participate in a loan forgiveness program. 
We understand the challenges faced by individuals who purchased taxi medallions.  Specifically, the fixed $250,000 price for a medallion is unsustainable, and needs to be lowered. Unfortunately, the SF Credit Union's Lender Agreement requires the Credit Union to consent to a lower price. For more than four years, the SFMTA has been advocating that the SF Credit Union allow us to lower the medallion sales price.   It is time for the Credit Union to work collaboratively with the SFMTA on a plan to do that. 

When taxis came under SFMTA’s umbrella in 2009, the method for distributing taxi medallions (a permit to operate a cab) was dysfunctional.  Until then, the fixed number of medallions available were distributed to taxi drivers in the order that they had placed their names on a list. There was fierce opposition to adding more permits, and the existing medallions were basically held for life. As a result, drivers could wait 15 years or more for their name to rise to the top of the waiting list. Proposition K, passed by voters in 1978, established a driving requirement for medallion holders, but many drivers were not in compliance. Adding to what was becoming a dysfunctional medallion system, the industry suffered from a reputation for poor customer service with no accountability.  

To help solve these longstanding challenges, the SFMTA established a pilot taxi medallion sale program in 2010. The early years of the program successfully allowed older medallion holders to retire, with a $200,000 windfall. Revenues from medallion sales went primarily to medallion holders and drivers (approximately $110M), and another $63M received by the SFMTA was applied toward supporting transit during the aftermath of the 2008-09 recession.  

The medallion sale program also allowed younger drivers to become small business owners by purchasing and holding a highly sought-after medallion.  

Unfortunately, a new and disruptive car service model was launched during this time, which allowed companies such as Uber and Lyft to begin operating in San Francisco outside the jurisdiction of the SMFTA and taxi industry rules.  Although the California Public Utilities Commission (CPUC) ultimately asserted jurisdiction over the “ride hail” industry, the framework they established ignored San Francisco’s taxi regulations (for example, the CPUC doesn’t require fingerprint background checks for drivers and they allow prices to change throughout the day).  Launched with incentives for drivers, seemingly unlimited venture capital advantage and free of oversight, the “ride hail” industry quickly came to dominate. 

The SFMTA Taxi Services team is focused on supporting the purchased medallion holders and drivers.  Already, taxis have become increasingly competitive in the market place.  We are eager to continue our work to simplify the medallion system in support of the purchased medallion program, promote improvements in customer service and support the competitiveness of the taxi industry.   This work is all the more important as taxis recover from the tremendous impact of the COVID-19 pandemic, and we hope the Credit Union will be part of the solution. 

We look forward to working with the industry in developing these reforms before presenting them to the SFMTA Board of Directors in 2022. 


Published November 17, 2021 at 01:22AM
https://ift.tt/3qJbhJd

Thursday, November 4, 2021

Central Subway Readies Fare Gates and Ticket Vending Machines

Central Subway Readies Fare Gates and Ticket Vending Machines
By Enrique Aguilar

In October, crews began installing and testing fare gate and ticket vending machine equipment at new underground stations that hundreds of Muni customers will use to pay for Muni fares once the Central Subway opens next year.

In addition to the new equipment being put into place at Chinatown/Rose Pak, Union Square/Market Street and Yerba Buena/Moscone stations, we are also continuing the train testing necessary to help us reach our goal of beginning service in 2022.

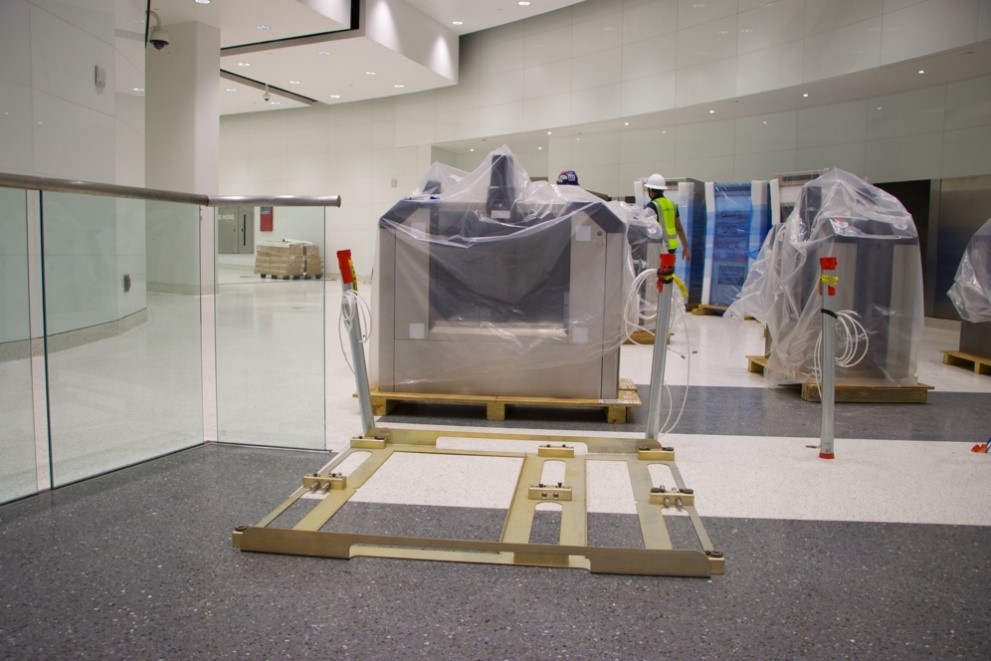
From the earliest stages of planning, our infrastructure design took into account the need for revenue management equipment like gates and fare machines. Like appliance placement in a brand-new home, architects developed the layout which construction workers build-out of the station’s interior. Crews will secure equipment, connect it to power and data sources and ensure cabling is in the appropriate location based on the station’s floor plan.

With construction winding down, the new equipment can now be bolted to the floor and any infrastructure adjustments can be made as needed. Network engineers at the SFMTA have also built the fiber-optic data network that will connect Central Subway stations to our central data system.

photo of drilling template used to place vending machine equipment

Drilling template for fare gates at Union Square/Market Street Station

If you ride Muni Metro via stations between Van Ness and Embarcadero, then you are likely familiar with the self-serve machines near station entrances allowing Muni customers to load value on  Clipper for iPhone and Android devices before tapping at fare gates leading to a station’s platform level. The Central Subway’s ticket vending machines and fare gates are identical to those found at other underground Metro stations and customers will pay for fares just like anywhere else in the system.

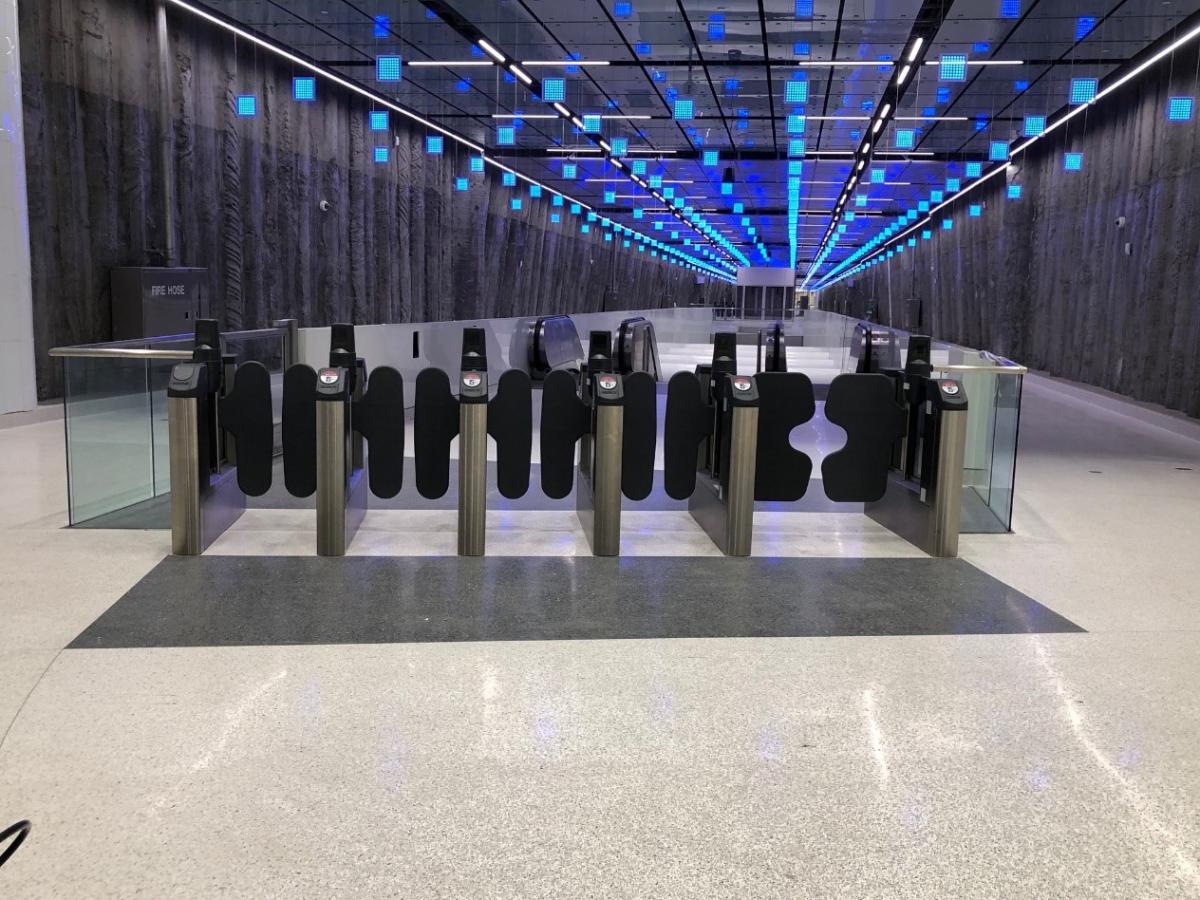
photo of faregates installed at Central Subway stationRecently installed fare gates near south entrance of Union Square/Market Street Station

Testing of fare gates and ticket vending machines will begin soon after installation as a part of the project’s current phase of testing critical systems.

To receive project updates via email or text, please sign up at the Central Subway webpage.


Published November 04, 2021 at 08:01PM
https://ift.tt/3bWsOoJ

Photo Exhibit Event: Vintage Bus Display and Tour

Photo Exhibit Event: Vintage Bus Display and Tour By Jeremy Menzies Join us Saturday, Jan. 27 at a special event for our exhibit, " 1...